With the proper license key, a probe can be set to run in enterprise mode where it collects traffic statistics from multiple remote probes running in their normal mode across your networks. An enterprise probe will give you a central logon to all your deployed network probes.
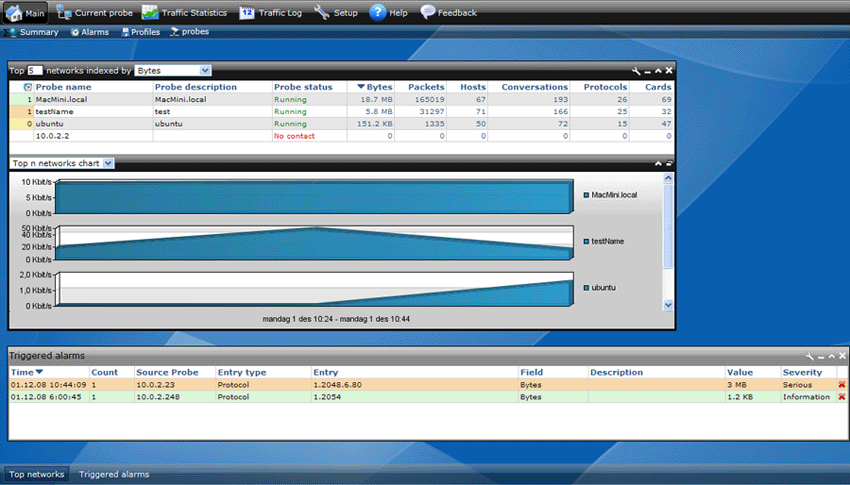
Logging in to an enterprise probe, the Main screen will display an overview of the most active networks and all alarms triggered on any probe deployed in your network and monitored by the enterprise probe, giving you a full overview of the traffic situation.

The "Main" tab of an enterprise probe features two windows: Top n networks window and a triggered alarms window.
The top networks window displays the most active probes. You can configure how many entries you want displayed and select between the traffic amount, or the number of hosts, conversations, protocols, or network cards seen on the network.
The triggered alarms window shows a collection of all the alarms triggered at the monitored probes. The window can be customized in the same way as other triggered alarms windows.
Running a probe in enterprise mode, the display will also show a "Current probe". Click on this to select a probe and browse its traffic statistics just as if you were logged on directly to that probe.