Bar Charts
Simple Bar Chart
simple bar chart

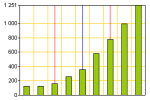
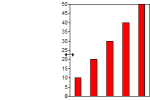
how to create a simple bar chart.

Chart Ranges
chart range

how to set the range values, color, position, labels, and adjuster.

Multiple Ranges
multiple ranges

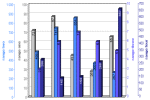
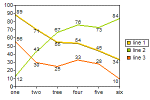
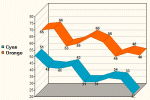
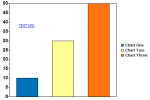
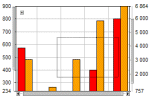
how to create a multiseries chart using different ranges.

Chart Labels
chart labels

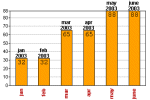
how to set sample labels, series labels angled, multiline, and floating labels.

More Chart Labels
more chart labels

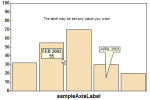
how to set chart title, range axis labels, sample axis label, anywhere labels labels.

Bar Style
bar style

how to set 3D depth and turn the bar outline off.

More Bar Style
bar style

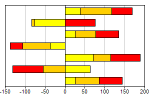
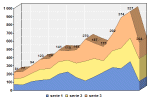
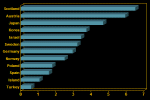
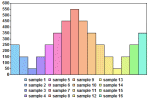
how to display stacked bars, 3D bars, horizontal bars.

Grid Lines
grid lines

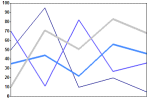
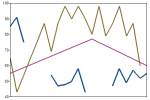
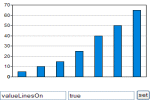
how to set value lines, default grid lines and user defined grid lines.

Target Lines
target lines

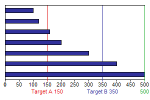
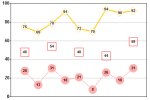
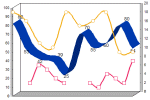
how to display value target lines.

Grid Image
grid image

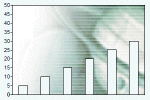
how to set a grid image.

Chart Colors
bar colors

how to set the bar colors, background and foreground colors.

JavaScript
javascript

how to control a chart using javascript.

URLs and Drilldown
urls and drilldown

how to add text urls and create drilldown charts.

Legend
legend

how to set the legend.

Insets Adjustment
bar insets

how to adjust the graph insets programmatically and in run time.

Zooming and Scrolling
zooming and scrolling

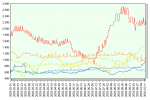
how to zoom and scroll the charts.

Line Charts
Line Labels
line labels

how to set sample, value and series labels.

Line Width
line width

how to set the line width.

Sample Highlight
sample highlight

how to display sample points on the lines.

3D Lines
3d lines

how to use 3D lines.

Stacked Lines
stacked lines

how to use stacked lines.

Connected Lines
connected lines

how to use empty values and connect broken lines.

Smooth Point Line Chart
spline

how to create smooth point line charts.

Time Line Chart
time line chart

how to use the time line chart.

Pie Charts
Simple Pie Chart
simple pie

how to create a simple pie chart with legend and title.

Pie Chart Labels
pie chart labels

how to set title, value, percent, and sample labels.

3D Pies
3d pies

how to create 3d pies.

Multiple Pies
multiple pies

how to create multiple pies inside one chart.

Plotter Charts
Many Plots
many plots

how to create simple plotter charts with many samples.

Bubble Chart
bubble chart

how to create bubble charts.

Line Width
line width

how to set the connected line width.

Plot Images
plot images

how to highlight plots with images.

Overlay Charts
Simple Overlay Chart
simple overlay

how to create a simple overlay chart.

Multiple Ranges
multiple ranges

how to create an overlay chart using multiple ranges.

JavaScript Overlay Chart
javascript overlay

controlling overlay charts using javascript.

Complex Overlay Chart
complex overlay

how to create a complex overlay chart.

Gauge Charts
Circular gauge
circular gauge

how to create a circular gauge chart.

180 degrees gauge.
180 deegrees

how to create a 180 degrees gauge chart.