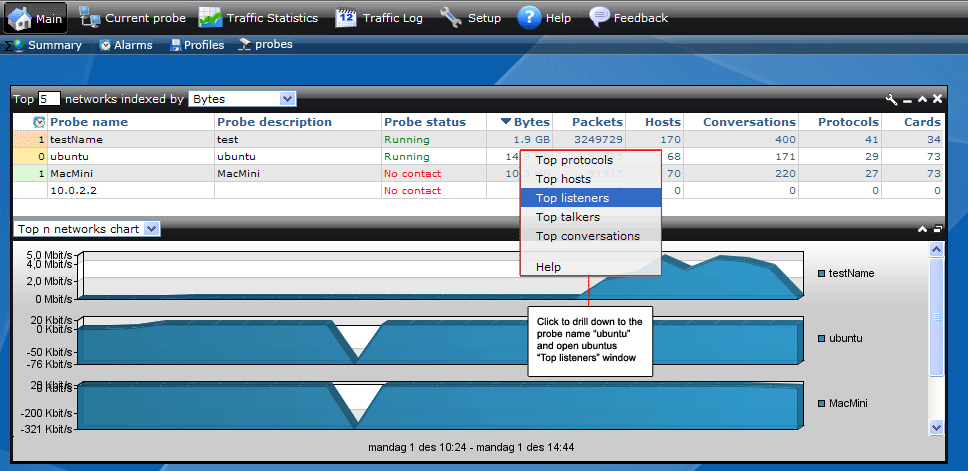
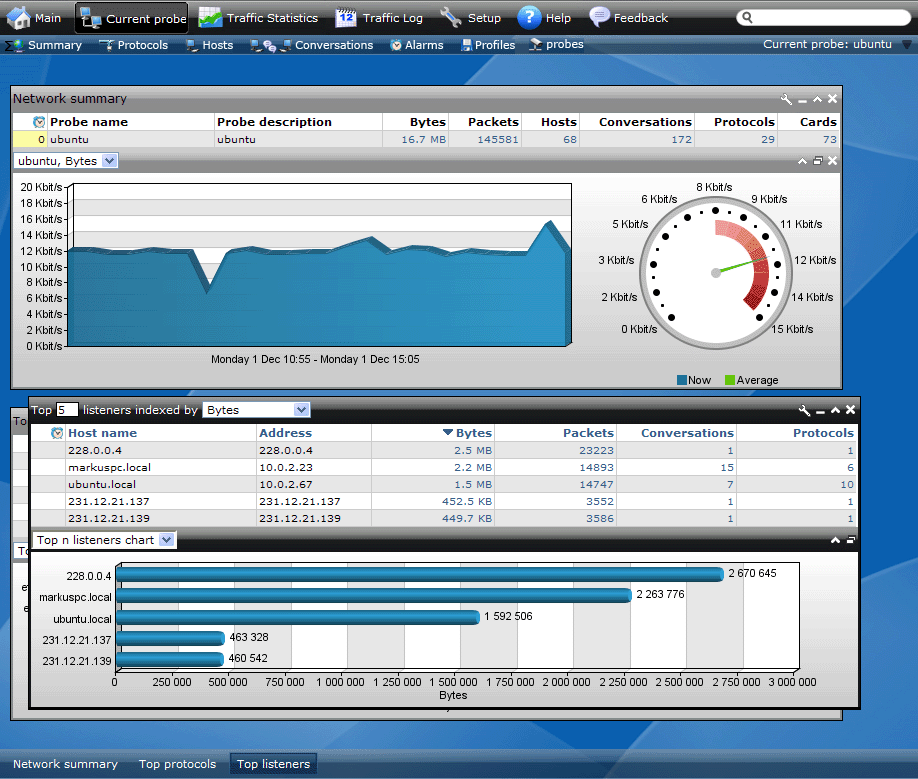
When in the 'Main' screen you can right-click on a probe entry to drill down into that probe's detailed traffic statistics. Once you select any of the Top X entries from the drop-down menu, the 'Current probe' screen will be displayed with the probe's traffic data loaded along with the selected Top X window.

The below image displays the resulting 'Current probe' screen with the data selected from the image above. Any other windows saved in this probe's profile will also be displayed.
