If your network is crawling to a standstill, and you suspect there might be a problem with the network traffic, Network Probe will quickly help you identify what is causing the problem and show you who is generating any troublesome traffic. The first thing you see when you log on to Network Probe is the Main screen. The Main screen gives you an instant overview over the top protocols, hosts and conversations. Using the Main screen you can quickly identify the protocol and host using up your bandwidth.
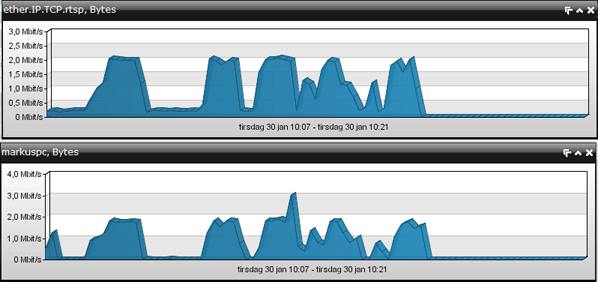
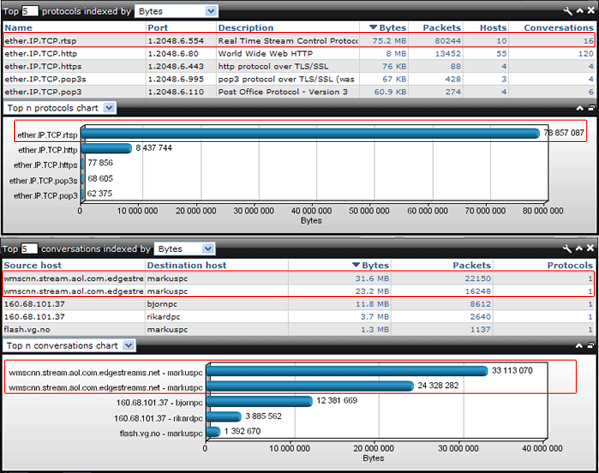
In the top protocols window you can see that rtsp is using a substantial part of the bandwidth. In the top host window you can see that markuspc is using the most bandwidth, and in the top conversations window you see that markuspc has two conversations with streams from cnn. Markuspc is most likely streaming some videos from cnn.
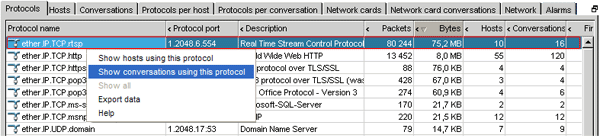
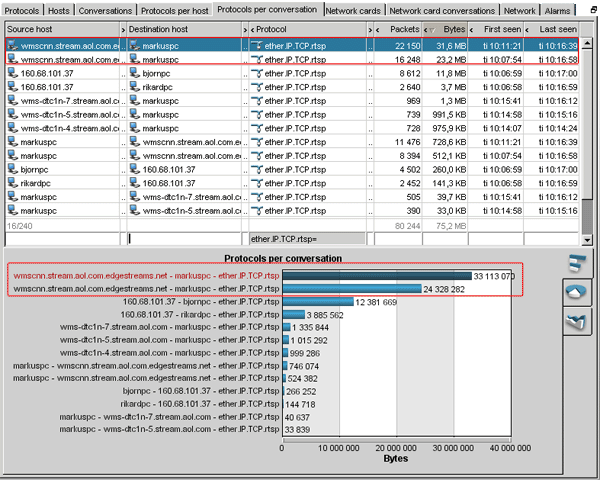
To get more details you can use the applet in the Traffic Statistics screen. In the "Protocols" tab right click on ether.IP.TCP.rtsp and click on "Show conversations using this protocol". This will open the "Protocols per conversation" tab. As in the top conversations window you see that markuspc has two conversations with streams from cnn. The first stream started 10:07 and the second at 10:11. Both streams were last seen at 10:16.
Now that you have identified the source of your network slowdown, you can use Network Probe to check if the host markuspc actually stops watching videos on cnn. To do this you can detach the interval chart for rtsp in the top protocols window, and the interval chart for markuspc in the top hosts window. You can also do this by detaching the interval chart for the two streams in the top conversations window.