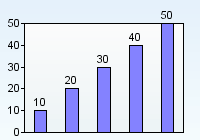
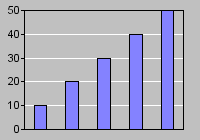
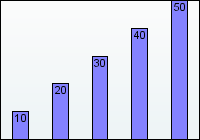
1. Loading Data
Data can be loaded using the applet parameters.
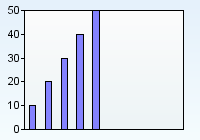
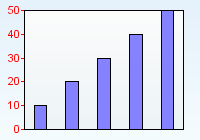
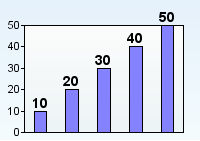
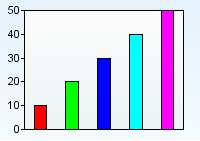
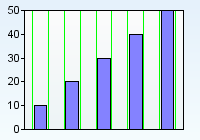
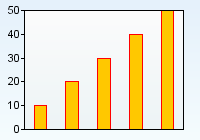
Use the sampleValues parameter to load data into the applet. The applet code below creates a bar chart and loads the values 10,20,30,40, and 50. The sample count of the chart will equal the number of values in the sampleValues parameter.
<applet code=com.objectplanet.chart.ChartApplet
archive=chart.jar width=200 height=140>
<param name=chart value="bar">
<param name=sampleValues value="10,20,30,40,50">
</applet>

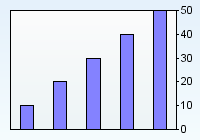
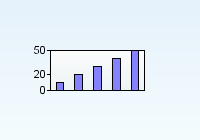
You can set the sample count explicitly by using the sampleCount parameter. The chart below sets the sample count to 10, but only sets the 5 first samples.
<applet code=com.objectplanet.chart.ChartApplet
archive=chart.jar width=200 height=140>
<param name=chart value="bar">
<param name=sampleCount value="10">
<param name=sampleValues value="10,20,30,40,50">
</applet>
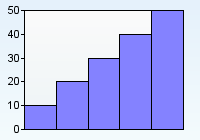
You can have empty values by using an undefined number (any sign that's not a valid number).
<applet code=com.objectplanet.chart.ChartApplet
archive=chart.jar width=200 height=140>
<param name=chart value="bar">
<param name=sampleValues value="10,20,30,40,x,x,70,80,90,100">
</applet>
![]()
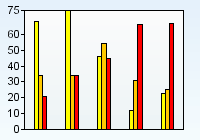
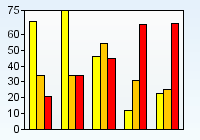
A chart can have multiple data series. When the chart has multiple data series the number of bars per sample equals the number of data series. Use the seriesCount parameter to control the number of data series, and the sampleValues_N parameter to set the values per data series.
<applet code=com.objectplanet.chart.ChartApplet
archive=chart.jar width=200 height=140>
<param name=chart value="bar">
<param name=seriesCount value=2>
<param name=sampleValues_0 value="72,87,65,78,65">
<param name=sampleValues_1 value="79,67,54,65,43">
<param name=multiColorOn value=true>
</applet>
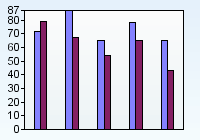
The multiColorOn parameter turns on multicolor mode which gives each data series it's own color.
Since the applet can not connect directly to a data source, any data that has to be loaded dynamically has to be generated on the server side.
Use a scripting language on the web server (such as ASP) to read the data
from a data base (or any other data source) and construct the applet
code using the values read. Then the web page is sent to the client
with the dynamically data ready to load into the applet.
<%
'## this function prints out the count for each department
function PrintDepartmentCount(ByRef employeeRS)
   While Not employeeRS.EOF
      Response.Write employeeRS("DepartmentCount") & ","
      employeeRS.MoveNext
   Wend
end function

'## open data connection
set DbConn=server.createobject("adodb.connection")
cnpath="DBQ=" & server.mappath("employees.mdb")
'Response.Write cnpath
DbConn.Open "DRIVER={Microsoft Access Driver (*.mdb)}; " & cnpath

'## Let's say we have one table with employees. One of the columns
'## is the department name, and the table name is employee

'## The following lines gets the number of employees for each department
Sql = "SELECT COUNT(*) AS DepartmentCount, Department
FROM Employee GROUP BY Department ORDER BY Department"
Set employeeRS = DbConn.Execute(Sql)
%>

<applet code=com.objectplanet.chart.ChartApplet
 archive=chart.jar width=640 height=200>
<param name=chart value="bar">
<param name=sampleValues value="<%call PrintDepartmentCount(employeeRS)%>">
</applet>
See here for full ASP example.
If you want to load the applet or servlet data and parameters from a url, you need specify the url in the data parameter in your applet or servlet tag as below
Applet:
<applet code=com.objectplanet.chart.BarChartApplet
archive=Chart.jar width=200 height=140>
<param name=data value="parameters.data">
</applet>
You can also configure the applet to load data from the currently specified data URL at a specific interval.
<applet code=com.objectplanet.chart.BarChartApplet
archive=Chart.jar width=200 height=140>
<param name=data value="parameters.data">
<param name=dataInterval value="10">
</applet>
The above applet will reload the parameters.data file at 10 second intervals. If you specify a new data parameter in the parameters.data file, this file will be loaded instead on the next interval.
<param name=dataInterval value="10,reset">
This will make the applet reset all it's data before the new data is loaded.
Servlet:
<img src="http://localhost:8080/servlet/com.objectplanet.chart.ChartServlet?
chart=bar&
width=200&
height=140&
data=http://somehost/parameters.data">
Only an applet or servlet can load the data from a URL. The parameters.data file looks like this:
seriesCount=3
sampleValues_0=27,38,76,57,65
sampleValues_1=23,76,87,65,34
sampleValues_2=23,46,77,88,93
sampleColors=yellow, orange, red
multiColorOn=true
barWidth=0.6
The data url can point to a script that produces the data as long as the format returned is as in the example above.
If you need to pass parameters to the script when using servlets, & for parameter separation and = for parameter value assignment can not be used. Instead you need to use � as the parameter separator and * for the equals sign.
<img src="http://localhost:8080/servlet/com.objectplanet.chart.ChartServlet?
chart=bar&
width=200&
height=140&
data=http://somehost/somescript.xyz?myparam*value�anotherparam*anothervalue&
background=white">
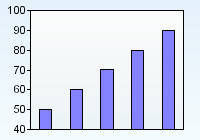
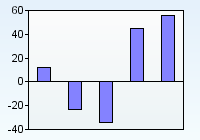
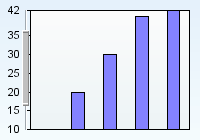
The range is set automatically according to the largest and smallest value of the chart. If the chart contains only positive values, the lower range will be set to 0. If the chart contains only positive values, the upper range will be set to 0.
<applet code=com.objectplanet.chart.ChartApplet
archive=chart.jar width=200 height=140>
<param name=chart value="bar">
<param name=sampleValues value="12,23,34,45,56">
</applet>

<applet code=com.objectplanet.chart.ChartApplet
archive=chart.jar width=200 height=140>
<param name=chart value="bar">
<param name=sampleValues value="12,-23,-34,45,56">
</applet>
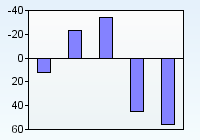
You can control the range explicitly by setting the range and lowerRange parameters.
<applet code=com.objectplanet.chart.ChartApplet
archive=chart.jar width=200 height=140>
<param name=chart value="bar">
<param name=sampleValues value="50,60,70,80,90">
<param name=range value=100>
<param name=lowerRange value=40>
</applet>
<applet code=com.objectplanet.chart.ChartApplet
archive=chart.jar width=200 height=140>
<param name=chart value="bar">
<param name=sampleValues value="12,-23,-34,45,56">
<param name=range value=60>
<param name=lowerRange value=-40>
</applet>
<applet code=com.objectplanet.chart.ChartApplet
archive=chart.jar width=200 height=140>
<param name=chart value="bar">
<param name=sampleValues value="12,-23,-34,45,56">
<param name=range value=-40>
<param name=lowerRange value=60>
</applet>
You can use automatic range setting, but still get even values in the upper and lower ranges by using the rangeStep parameter. If you set the rangeStep parameter, the upper range will be set to the next value larger than the maximum value that is divisible by the range step given.
<applet code=com.objectplanet.chart.ChartApplet
archive=chart.jar width=200 height=140>
<param name=chart value="bar">
<param name=sampleValues value="12,-23,-34,45,56">
<param name=rangeStep value=10>
</applet>
Set the range position using the rangePosition parameter. The positions are left and right (or top or bottom if you use horizontal bars).
<applet code=com.objectplanet.chart.ChartApplet
archive=chart.jar width=200 height=140>
<param name=chart value="bar">
<param name=sampleValues value="10,20,30,40,50">
<param name=rangePosition value=right>
</applet>
Set the color of the range labels and ticks using the rangeColor parameter. The color values can be the color name or the html hex code color number.
<applet code=com.objectplanet.chart.ChartApplet
archive=chart.jar width=200 height=140>
<param name=chart value="bar">
<param name=sampleValues value="10,20,30,40,50">
<param name=rangeColor value=red>
</applet>
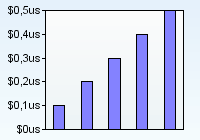
You can set the font used for the range value labels, set the number of decimals to be displayed, set a prefix or postfix, or turn them off.
<applet code=com.objectplanet.chart.ChartApplet
archive=chart.jar width=200 height=140>
<param name=chart value="bar">
<param name=sampleValues value="0.1,0.2,0.3,0.4,0.5">
<param name=rangeLabelPrefix value="$">
<param name=rangeLabelPostfix value="us">
<param name=rangeDecimalCount value=1>
</applet>
Set the font used for the range value labels using the rangeLabelFont parameter.
<applet code=com.objectplanet.chart.ChartApplet
archive=chart.jar width=200 height=140>
<param name=chart value="bar">
<param name=sampleValues value="10,20,30,40,50">
<param name=rangeLabelFont value="Arial, bold, 14">
</applet>
The first argument to the rangeLabelFont is the font name, the second is plain, bold, italic, or bolditalic. The last argument is the point size of the font.
You can turn off the range label values using the rangeLabelsOff parameter.
<applet code=com.objectplanet.chart.ChartApplet
archive=chart.jar width=200 height=140>
<param name=chart value="bar">
<param name=sampleValues value="10,20,30,40,50">
<param name=rangeLabelsOff value="true">
</applet>
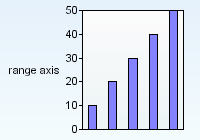
You can add a label to the range axis by using the rangeAxisLabel parameter.
<applet code=com.objectplanet.chart.ChartApplet
archive=chart.jar width=200 height=140>
<param name=chart value="bar">
<param name=sampleValues value="10,20,30,40,50">
<param name=rangeAxisLabel value="range axis">
</applet>
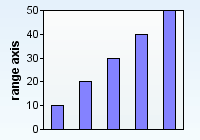
Set the clockwise angle and the font of the label using the rangeAxisLabelAngle and rangeAxisLabelFont parameters.
<applet code=com.objectplanet.chart.ChartApplet
archive=chart.jar width=200 height=140>
<param name=chart value="bar">
<param name=sampleValues value="10,20,30,40,50">
<param name=rangeAxisLabel value="range axis">
<param name=rangeAxisLabelAngle value="270">
<param name=rangeAxisLabelFont value="Arial, bold, 12">
</applet>
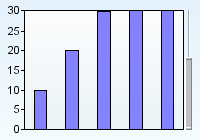
You can control the upper and lower ranges at runtime using the range adjuster.
<applet code=com.objectplanet.chart.ChartApplet
archive=chart.jar width=200 height=140>
<param name=chart value="bar">
<param name=sampleValues value="10,20,30,40,50">
<param name=rangeAdjusterOn value="true">
</applet>
Control the range adjuster position using the rangeAdjusterPosition parameter. The different positions are left and right (or top and bottom if bars are horizontal).
<applet code=com.objectplanet.chart.ChartApplet
archive=chart.jar width=200 height=140>
<param name=chart value="bar">
<param name=sampleValues value="10,20,30,40,50">
<param name=rangeAdjusterOn value="true">
<param name=rangeAdjusterPosition value="left">
</applet>
You can have two and more range axis by using the rangeOn_N parameter. Associate a data series with a range axis using the seriesRange_N parameter.
<applet code=com.objectplanet.chart.ChartApplet
archive=chart.jar width=200 height=140>
<param name=chart value="bar">
<param name=seriesCount value="2">
<param name=sampleValues_0 value="10,20,30,40,50">
<param name=sampleValues_1 value="3,6,8,3,2">
<param name=seriesRange_1 value="2">
<param name=rangeOn_2 value="true">
<param name=multiColorOn value=true>
<param name=barWidth value="0.6">
</applet>
The rangeOn_2 parameter turns the second range on (default position for the second range is to the right). The seriesRange_1 parameter says that data series 1 (starts on 0) will be associated with range number 2 (ranges are numbered 1 and 2).
<applet code=com.objectplanet.chart.ChartApplet
archive=chart.jar width=250 height=140>
<param name=chart value="bar">
<param name=seriesCount value="3">
<param name=sampleValues_0 value="10,20,30,40,50">
<param name=sampleValues_1 value="3,6,8,3,2">
<param name=sampleValues_2 value="120,430,340,90,180">
<param name=seriesRange_1 value="2">
<param name=seriesRange_2 value="3">
<param name=rangeOn_2 value="true">
<param name=rangeOn_3 value="true">
<param name=rangePosition_2 value="left">
<param name=multiColorOn value=true>
<param name=barWidth value="0.6">
</applet>
| multiple range parameters | ||
| range_N | sets the second range's upper value | |
| lowerRange_N | sets the second range's lower value | |
| rangeStep_N | sets the range step for the second range | |
| rangePosition_N | sets the range position for the second range | |
| rangeColor_N | sets the color of the second range's ticks and value labels | |
| rangeAxisLabel_N | sets the second range axis label | |
| rangeAxisLabelAngle_N | sets the angle of the second range axis label | |
| rangeDecimalCount_N | sets the decimal count used for the second range axis | |
| rangeAdjusterOn_N | turns on the second range adjuster | |
| rangeAdjusterPosition_N | sets the position of the second range adjuster | |
You can control which range axis a range adjuster should adjust. One range adjuster can also adjust both ranges.
<applet code=com.objectplanet.chart.ChartApplet
archive=chart.jar width=200 height=140>
<param name=chart value="bar">
<param name=seriesCount value="2">
<param name=sampleValues_0 value="10,20,30,40,50">
<param name=sampleValues_1 value="3,6,8,3,2">
<param name=seriesRange_1 value="2">
<param name=rangeOn_2 value="true">
<param name=rangeAdjusterOn value="true">
<param name=rangeAdjusterPosition value="true">
<param name=rangeAdjusterOn_2 value="true">
<param name=rangeAdjusted_1 value="all">
<param name=rangeAdjusted_2 value="2">
<param name=multiColorOn value=true>
<param name=barWidth value="0.6">
</applet>
The parameter rangeAdjusted_1 controls which range(s) will be adjusted using adjuster number 1. In this case, it will control both ranges. The parameter rangeAdjusted_2 controls the second adjuster, which controls range 2 in this case (default).
<applet code=com.objectplanet.chart.ChartApplet
archive=chart.jar width=250 height=140>
<param name=chart value="bar">
<param name=seriesCount value="4">
<param name=sampleValues_0 value="10,20,30,40,50">
<param name=sampleValues_1 value="3,6,8,3,2">
<param name=sampleValues_2 value="120,430,340,90,180">
<param name=seriesRange_1 value="2">
<param name=seriesRange_2 value="3">
<param name=rangeOn_2 value="true">
<param name=rangeOn_3 value="true">
<param name=rangePosition_1 value="right">
<param name=rangePosition_3 value="right">
<param name=rangeAdjusterOn value="true">
<param name=rangeAdjusterOn_2 value="true">
<param name=rangeAdjusterOn_3 value="true">
<param name=rangeAdjusted_1 value="all">
<param name=multiColorOn value=true>
<param name=barWidth value="0.6">
</applet>
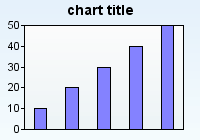
The chartTitle parameter adds a label at the top center of the chart.
<applet code=com.objectplanet.chart.ChartApplet
archive=chart.jar width=200 height=140>
<param name=chart value="bar">
<param name=sampleValues value="10,20,30,40,50">
<param name=chartTitle value="chart title">
</applet>
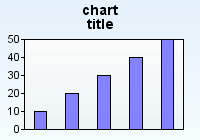
You can have multiline labels by using a \n (goes for all chart labels).
<applet code=com.objectplanet.chart.ChartApplet
archive=chart.jar width=200 height=140>
<param name=chart value="bar">
<param name=sampleValues value="10,20,30,40,50">
<param name=chartTitle value="chart\ntitle">
</applet>
The titleFont parameter sets the font used for the title.
<applet code=com.objectplanet.chart.ChartApplet
archive=chart.jar width=200 height=140>
<param name=chart value="bar">
<param name=sampleValues value="10,20,30,40,50">
<param name=chartTitle value="chart title">
<param name=titleFont value="Courier, bold, 20">
</applet>
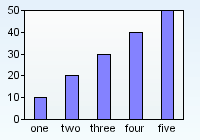
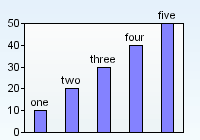
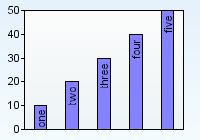
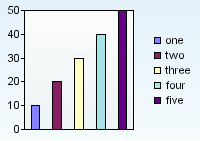
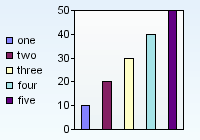
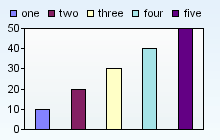
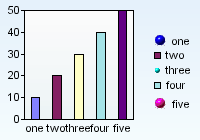
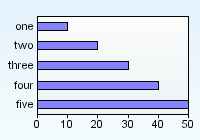
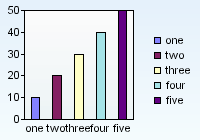
You can add a label to each sample/bar in the chart by using the sampleLabels parameter. The sample labels can either be displayed inside, outside, below each bar, floating over each bar when the mouse moves over it, or in the legend. Use the sampleLabelsOn parameter to turn them on.
<applet code=com.objectplanet.chart.ChartApplet
archive=chart.jar width=200 height=140>
<param name=chart value="bar">
<param name=sampleValues value="10,20,30,40,50">
<param name=sampleLabels value="one,two,three,four,five">
<param name=sampleLabelsOn value=true>
<param name=sampleLabelStyle value=below>
</applet>
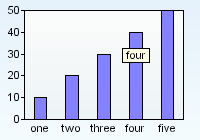
The sampleLabelStyle controls how the labels are displayed (inside, outside, below, floating, or below_and_floating). Use the floatingLabelFont to control the font used for the floating labels.
<applet code=com.objectplanet.chart.ChartApplet
archive=chart.jar width=200 height=140>
<param name=chart value="bar">
<param name=sampleValues value="10,20,30,40,50">
<param name=sampleLabels value="one,two,three,four,five">
<param name=sampleLabelsOn value=true>
<param name=sampleLabelStyle value="floating">
</applet>

The sampleLabelAngle parameter controls the clockwise angle of the sample labels.
<applet code=com.objectplanet.chart.ChartApplet
archive=chart.jar width=200 height=140>
<param name=chart value="bar">
<param name=sampleValues value="10,20,30,40,50">
<param name=sampleLabels value="one,two,three,four,five">
<param name=sampleLabelsOn value=true>
<param name=sampleLabelStyle value="inside">
<param name=sampleLabelAngle value="270">
</applet>
Use the sampleLabelFont parameter to control the font used for the sample labels.
<applet code=com.objectplanet.chart.ChartApplet
archive=chart.jar width=200 height=140>
<param name=chart value="bar">
<param name=sampleValues value="10,20,30,40,50">
<param name=sampleLabels value="one,two,three,four,five">
<param name=sampleLabelsOn value=true>
<param name=sampleLabelAngle value="270">
<param name=sampleLabelStyle value="inside">
<param name=sampleLabelFont value="Arial, bold, 11">
</applet>

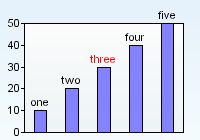
You can set the color of the sample labels using the sampleLabelColors parameter.
<applet code=com.objectplanet.chart.ChartApplet
archive=chart.jar width=200 height=140>
<param name=chart value="bar">
<param name=sampleValues value="10,20,30,40,50">
<param name=sampleLabels value="one,two,three,four,five">
<param name=sampleLabelStyle value="outside">
<param name=sampleLabelColors value="black, black, red, black, black">
<param name=sampleLabelsOn value=true>
</applet>
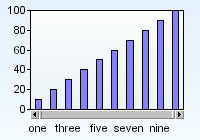
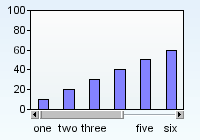
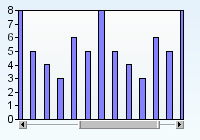
If you have too many labels close to each other, they overwrite and clutter up. Turn on the autoLabelSpacingOn parameter to paint only the sample labels there are space for.
<applet code=com.objectplanet.chart.ChartApplet
archive=chart.jar width=200 height=140>
<param name=chart value="bar">
<param name=sampleValues value="10,20,30,40,50,60,70,80,90,100">
<param name=sampleLabels value="one,two,three,four,five,six,seven,eight,nine,ten">
<param name=sampleLabelsOn value=true>
<param name=sampleLabelStyle value=below>
<param name=autoLabelSpacingOn value=true>
<param name=sampleScrollerOn value=true>
</applet>
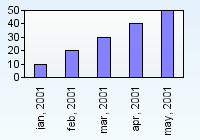
The default label field delimiter used is comma (,). If you want commas
in your labels, you need to set a different label field delimiter.
The label delimiter has effect on the sample labels, series labels,
bar labels, legend labels, and target value line labels.
<applet code=com.objectplanet.chart.ChartApplet
archive=chart.jar width=200 height=140>
<param name=chart value="bar">
<param name=sampleValues value="10,20,30,40,50">
<param name=labelDelimiter value=":">
<param name=sampleLabels value="jan, 2001:feb, 2001:mar, 2001:apr, 2001:may, 2001">
<param name=sampleLabelsOn value=true>
<param name=sampleLabelAngle value=270>
<param name=sampleLabelStyle value=below>
</applet>
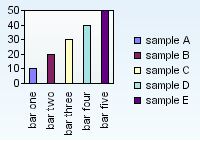
3.3 Bar labels
By default the bar labels is set using the sampleLabels, and will be the
same as the legend labels and the floating sample labels. The barLabels
parameter overrides the sampleLabels and sets the bar labels differently
from the sampleLabels.
<applet code=com.objectplanet.chart.ChartApplet
archive=chart.jar width=200 height=140>
<param name=chart value="bar">
<param name=sampleValues value="10,20,30,40,50">
<param name=sampleLabels value="sample one,sample two,sample three,sample four,sample five">
<param name=sampleLabelsOn value=true>
<param name=sampleLabelStyle value="below_and_floating">
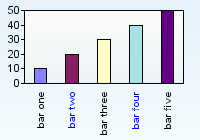
<param name=barLabels value="bar one,bar two,bar three,bar four,bar five">
<param name=barLabelsOn value=true>
<param name=barLabelAngle value="270">
<param name=legendOn value=true>
<param name=multiColorOn value=true>
</applet>
Use barLabelAngle, barLabelFont, barLabelColors parameter to set angle, font and colors for bar labels.
<applet code=com.objectplanet.chart.ChartApplet
archive=chart.jar width=200 height=140>
<param name=chart value="bar">
<param name=sampleValues value="10,20,30,40,50">
<param name=barLabels value="bar one,bar two,bar three,bar four,bar five">
<param name=barLabelsOn value=true>
<param name=barLabelAngle value="270">
<param name=barLabelFont value="Arial, BOLD, 10">
<param name=barLabelColors value="black,blue,black,blue,black">
<param name=multiColorOn value=true>
</applet>
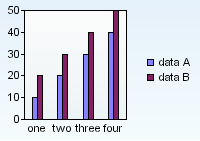
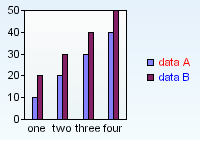
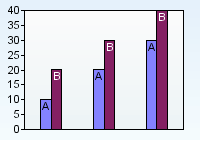
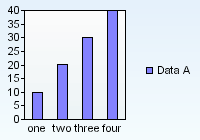
When using multiple data series you set a label for each data series using the seriesLabels parameter. The legend will display the series labels instead of the sample labels as in a chart with one data series.
<applet code=com.objectplanet.chart.ChartApplet
archive=chart.jar width=200 height=140>
<param name=chart value="bar">
<param name=seriesCount value="2">
<param name=sampleValues_0 value="10,20,30,40">
<param name=sampleValues_1 value="20,30,40,50">
<param name=sampleLabels value="one,two,three,four,five">
<param name=seriesLabels value="data A,data B">
<param name=sampleLabelsOn value=true>
<param name=sampleLabelStyle value=below>
<param name=legendOn value=true>
<param name=multiColorOn value=true>
</applet>
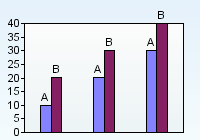
Use the seriesLabelColors to set the colors of the series labels in the legend.
<applet code=com.objectplanet.chart.ChartApplet
archive=chart.jar width=200 height=140>
<param name=chart value="bar">
<param name=seriesCount value="2">
<param name=sampleValues_0 value="10,20,30,40,50">
<param name=sampleValues_1 value="20,30,40,50,60">
<param name=sampleLabels value="one,two,three,four,five">
<param name=seriesLabels value="data A,data B">
<param name=seriesLabelColors value="red, blue">
<param name=sampleLabelsOn value=true>
<param name=sampleLabelStyle value=below>
<param name=legendOn value=true>
<param name=multiColorOn value=true>
</applet>
The seriesLabelsOn turns on the floating series labels. Use the floatingLabelFont to control the font used for the floating labels.
<applet code=com.objectplanet.chart.ChartApplet
archive=chart.jar width=200 height=140>
<param name=chart value="bar">
<param name=seriesCount value="2">
<param name=sampleValues_0 value="10,20,30,40,50">
<param name=sampleValues_1 value="20,30,40,50,60">
<param name=seriesLabels value="data A,data B">
<param name=seriesLabelStyle value="floating">
<param name=seriesLabelsOn value=true>
<param name=multiColorOn value=true>
</applet>
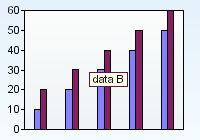
The sereisLabelStyle controls how the labels are displayed (inside, outside, floating).
<applet code=com.objectplanet.chart.ChartApplet
archive=chart.jar width=200 height=140>
<param name=chart value="bar">
<param name=seriesCount value="2">
<param name=sampleValues_0 value="10,20,30">
<param name=sampleValues_1 value="20,30,40">
<param name=seriesLabels value="A,B">
<param name=seriesLabelsOn value=true>
<param name=seriesLabelStyle value=inside>
<param name=multiColorOn value=true>
</applet>
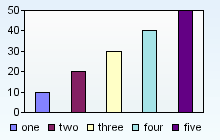
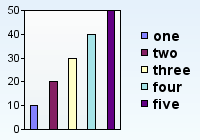
The legend is turned on using the legendOn parameter.
<applet code=com.objectplanet.chart.ChartApplet
archive=chart.jar width=200 height=140>
<param name=chart value="bar">
<param name=sampleValues value="10,20,30,40,50">
<param name=sampleLabels value="one,two,three,four,five">
<param name=legendOn value=true>
<param name=multiColorOn value=true>
</applet>
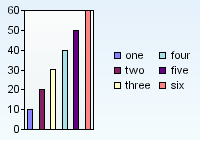
The legend position is controlled using the legendPosition parameter. The position can be right (default), left, top, or bottom.
<applet code=com.objectplanet.chart.ChartApplet
archive=chart.jar width=220 height=140>
<param name=chart value="bar">
<param name=sampleValues value="10,20,30,40,50">
<param name=sampleLabels value="one,two,three,four,five">
<param name=legendOn value=true>
<param name=legendPosition value=left>
<param name=multiColorOn value=true>
</applet>
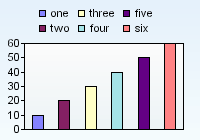
Align legend entries by rows and columns using the legendColumns parameter.
<applet code=com.objectplanet.chart.ChartApplet
archive=chart.jar width=200 height=140>
<param name=chart value="bar">
<param name=sampleValues value="10,20,30,40,50,60">
<param name=sampleLabels value="one,two,three,four,five,six">
<param name=legendOn value=true>
<param name=legendPosition value=top>
<param name=legendColumns value=3>
<param name=multiColorOn value=true>
</applet>
Control the font used for the legend labels using the legendFont parameter.
<applet code=com.objectplanet.chart.ChartApplet
archive=chart.jar width=200 height=140>
<param name=chart value="bar">
<param name=sampleValues value="10,20,30,40,50">
<param name=sampleLabels value="one,two,three,four,five">
<param name=legendOn value=true>
<param name=legendFont value="Arial, bold, 14">
<param name=multiColorOn value=true>
</applet>
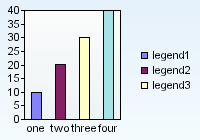
By default the legend contains the sample labels when one data series is used or the series labels when multiple data series is used. You can override this by using the legendLabels parameter.
<applet code=com.objectplanet.chart.ChartApplet
archive=chart.jar width=200 height=140>
<param name=chart value="bar">
<param name=sampleValues value="10,20,30,40,50">
<param name=sampleLabels value="one,two,three,four,five">
<param name=barLabelsOn value=true>
<param name=legendLabels value="legend1,legend2,legend3">
<param name=legendOn value=true>
<param name=multiColorOn value=true>
</applet>
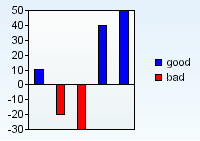
The color of the legend boxes are the same as the sample colors. Use the legendColors parameter to explicitly set the legend colors.
<applet code=com.objectplanet.chart.ChartApplet
archive=chart.jar width=200 height=140>
<param name=chart value="bar">
<param name=sampleValues value="10,-20,-30,40,50">
<param name=sampleColors value="blue, red, red, blue, blue">
<param name=multiColorOn value=true>
<param name=legendOn value=true>
<param name=legendLabels value="good,bad">
<param name=legendColors value="blue, red">
</applet>
Any legend box may be replaced by an image.
<applet code=com.objectplanet.chart.ChartApplet
archive=chart.jar width=200 height=140>
<param name=chart value="bar">
<param name=sampleValues value="10,20,30,40,50">
<param name=sampleLabels value="one,two,three,four,five">
<param name=barLabelsOn value=true>
<param name=legendOn value=true>
<param name=multiColorOn value=true>
<param name=legendImage_0 value="images/blue-ball.gif">
<param name=legendImage_2 value="images/cyan-ball-small.gif">
<param name=legendImage_4 value="images/magenta-ball.gif">
</applet>
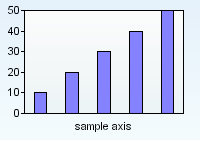
Add a label to the sample axis using the sampleAxisLabel parameter.
<applet code=com.objectplanet.chart.ChartApplet
archive=chart.jar width=200 height=140>
<param name=chart value="bar">
<param name=sampleValues value="10,20,30,40,50">
<param name=sampleAxisLabel value="sample axis">
</applet>
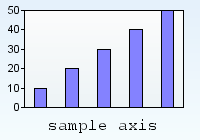
Use the sampleAxisLabelFont parameter to set the font used.
<applet code=com.objectplanet.chart.ChartApplet
archive=chart.jar width=200 height=140>
<param name=chart value="bar">
<param name=sampleValues value="10,20,30,40,50">
<param name=sampleAxisLabel value="sample axis">
<param name=sampleAxisLabelFont value="Courier, plain, 16">
</applet>
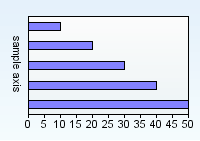
If the bars are horizontal, you can set the sample axis label using the sampleAxisLabelAngle parameter.
<applet code=com.objectplanet.chart.ChartApplet
archive=chart.jar width=200 height=140>
<param name=chart value="bar">
<param name=sampleValues value="10,20,30,40,50">
<param name=sampleAxisLabel value="sample axis">
<param name=sampleAxisLabelAngle value="90">
<param name=barAlignment value="horizontal">
</applet>
Turn on the bar value labels using the valueLabelsOn parameter. Use the valueLabelsOn_N parameter option to turn on or off the value labels for each data series.
<applet code=com.objectplanet.chart.ChartApplet
archive=chart.jar width=200 height=140>
<param name=chart value="bar">
<param name=sampleValues value="10,20,30,40,50">
<param name=valueLabelsOn value="true">
</applet>
The value labels can either be displayed outside the bars, inside the bars, or floating above each bar when the mouse moves over. Use the valueLabelStyle parameter with values inside, outside, or floating.
<applet code=com.objectplanet.chart.ChartApplet
archive=chart.jar width=200 height=140>
<param name=chart value="bar">
<param name=sampleValues value="10,20,30,40,50">
<param name=valueLabelsOn value="true">
<param name=valueLabelStyle value="inside">
</applet>

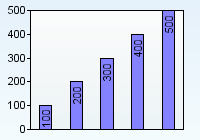
Set the angle of the value labels with the valueLabelAngle parameter.
<applet code=com.objectplanet.chart.ChartApplet
archive=chart.jar width=200 height=140>
<param name=chart value="bar">
<param name=sampleValues value="100,200,300,400,500">
<param name=valueLabelsOn value="true">
<param name=valueLabelStyle value="inside">
<param name=valueLabelAngle value="270">
</applet>
Use the valueLabelsFont parameter to control the fonts.
<applet code=com.objectplanet.chart.ChartApplet
archive=chart.jar width=200 height=140>
<param name=chart value="bar">
<param name=sampleValues value="10,20,30,40,50">
<param name=valueLabelsOn value="true">
<param name=valueLabelFont value="Arial, bold, 14">
</applet>
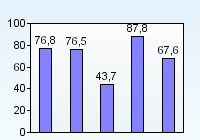
Use the sampleDecimalCount parameter to control the number of decimals used for the value labels. Use sampleDecimalCount_N to control the number of decimals per data series.
<applet code=com.objectplanet.chart.ChartApplet
archive=chart.jar width=200 height=140>
<param name=chart value="bar">
<param name=sampleValues value="76.8, 76.5, 43.7, 87.8, 67.6">
<param name=valueLabelsOn value="true">
<param name=sampleDecimalCount value="1">
<param name=rangeStep value="100">
</applet>
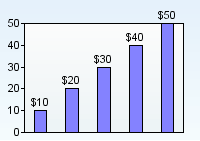
You can add a prefix and postfix to the value labels using the valueLabelPrefix and valueLabelPostfix parameters. To set a pre- and postfix per data series, add a _N (where N is the series number) to each parameter.
<applet code=com.objectplanet.chart.ChartApplet
archive=chart.jar width=200 height=140>
<param name=chart value="bar">
<param name=sampleValues value="10,20,30,40,50">
<param name=valueLabelsOn value="true">
<param name=valueLabelPrefix value="$">
</applet>
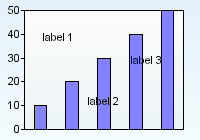
You can set any label at any place by using label_N parameter. The parameter takes absolute or relative coordinates.
<applet code=com.objectplanet.chart.ChartApplet
width=200 height=140>
<param name=chart value="bar">
<param name=sampleValues value="10,20,30,40,50">
<param name=label_0 value="label 1, 40, 40">
<param name=label_1 value="label 2, 0.5, 0.8">
<param name=label_2 value="label 3, 0.85, 0.4">
</applet>
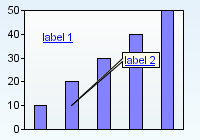
The label can point to any sample if you specify the index and series of the sample. In this case the label can be dragged using the mouse.
<applet code=com.objectplanet.chart.ChartApplet
width=200 height=140>
<param name=chart value="bar">
<param name=sampleValues value="10,20,30,40,50">
<param name=label_0 value="label 1, 40, 40, 1, 0">
<param name=label_1 value="label 2, 0.5, 0.8, 3, 0">
</applet>
![]()
An URL adress can be assigned to a label using labelURL_N parameter. In this case a new web page is opened when user clicks the label.
<applet code=com.objectplanet.chart.ChartApplet
width=200 height=140>
<param name=chart value="bar">
<param name=sampleValues value="10,20,30,40,50">
<param name=label_0 value="label 1, 40, 40">
<param name=label_1 value="label 2, 0.8, 0.4, 1, 0">
<param name=labelURL_0 value="objectplanet.com">
<param name=labelURL_1 value="www.objectplanet.com/EasyCharts">
</applet>
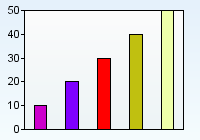
You can make each bar have a seperate color by using the multiColorOn parameter.
<applet code=com.objectplanet.chart.ChartApplet
archive=chart.jar width=200 height=140>
<param name=chart value="bar">
<param name=sampleValues value="10,20,30,40,50">
<param name=multiColorOn value="true">
</applet>
Use the sampleColors parameter to set the colors of the bars. If you have one data series, the sampleColors will set the color for each individual bar. If you have multiple data series, the sampleColors will set the color for each data serie.
If you have only single colored bars, the sampleColors parameter should contain one value.
<applet code=com.objectplanet.chart.ChartApplet
archive=chart.jar width=200 height=140>
<param name=chart value="bar">
<param name=sampleValues value="10,20,30,40,50">
<param name=sampleColors value="red">
</applet>
If you have multiColorOn set, the sampleColors parameter should contain a color entry for each sample.
<applet code=com.objectplanet.chart.ChartApplet
archive=chart.jar width=200 height=140>
<param name=chart value="bar">
<param name=sampleValues value="10,20,30,40,50">
<param name=sampleColors value="red, green, blue, cyan, magenta">
<param name=multiColorOn value="true">
</applet>
You can use color names as above, or you can use html hex codes for the colors as in the example below.
<applet code=com.objectplanet.chart.ChartApplet
archive=chart.jar width=200 height=140>
<param name=chart value="bar">
<param name=sampleValues value="10,20,30,40,50">
<param name=sampleColors value="#cc00cc, #7f00ff, red, #c0c010, #eeffaa">
<param name=multiColorOn value="true">
</applet>
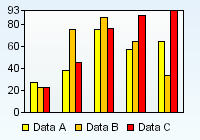
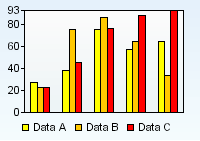
If you have multiple data series, the colors set is per data serie.
<applet code=com.objectplanet.chart.ChartApplet
archive=chart.jar width=200 height=140>
<param name=chart value="bar">
<param name=seriesCount value=3>
<param name=sampleValues_0 value="27,38,76,57,65">
<param name=sampleValues_1 value="23,76,87,65,34">
<param name=sampleValues_2 value="23,46,77,88,93">
<param name=sampleColors value="yellow, orange, red">
<param name=multiColorOn value="true">
<param name=barWidth value="0.6">
<param name=seriesLabels value="Data A,Data B,Data C">
<param name=legendOn value=true>
<param name=legendPosition value=bottom>
</applet>
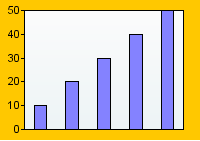
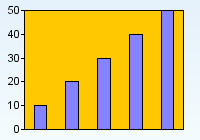
Set the chart component background color using the background parameter. This does not include the chart grid background color.
<applet code=com.objectplanet.chart.ChartApplet
archive=chart.jar width=200 height=140>
<param name=chart value="bar">
<param name=sampleValues value="10,20,30,40,50">
<param name=background value="orange">
</applet>
Set the color of the chart grid background using the chartBackground parameter.
<applet code=com.objectplanet.chart.ChartApplet
archive=chart.jar width=200 height=140>
<param name=chart value="bar">
<param name=sampleValues value="10,20,30,40,50">
<param name=chartBackground value="orange">
</applet>
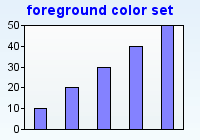
Set the chart component foreground color using the foreground parameter.
<applet code=com.objectplanet.chart.ChartApplet
archive=chart.jar width=200 height=140>
<param name=chart value="bar">
<param name=sampleValues value="10,20,30,40,50">
<param name=foreground value="blue">
<param name=chartTitle value="foreground color set">
</applet>
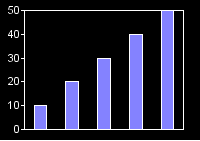
Set the foreground color of the chart grid elements.
<applet code=com.objectplanet.chart.ChartApplet
archive=chart.jar width=200 height=140>
<param name=chart value="bar">
<param name=sampleValues value="10,20,30,40,50">
<param name=chartForeground value="white">
<param name=chartBackground value="black">
<param name=background value="black">
</applet>
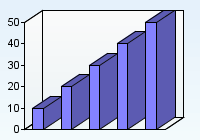
Through the applet parameters you can control how the chart is displayed.
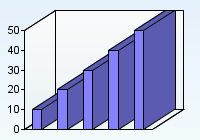
Turn on 3D mode with the 3DModeOn parameter.
<applet code=com.objectplanet.chart.ChartApplet
archive=chart.jar width=200 height=140>
<param name=chart value="bar">
<param name=sampleValues value="10,20,30,40,50">
<param name=3DModeOn value="true">
</applet>
Set the depth of the 3D chart.
<applet code=com.objectplanet.chart.ChartApplet
archive=chart.jar width=200 height=140>
<param name=chart value="bar">
<param name=sampleValues value="10,20,30,40,50">
<param name=3DModeOn value="true">
<param name=3DDepth value="25">
</applet>
If you have many samples you can use the sample scroller to display a subset of the samples and scroll or zoom them.
<applet code=com.objectplanet.chart.ChartApplet
archive=chart.jar width=200 height=140>
<param name=chart value="bar">
<param name=sampleValues value="6,5,8, ... ,5,4,3">
<param name=sampleScrollerOn value="true">
</applet>
Using the visibleSample parameter you can control the initial sample displayed when using the sample scroller.
<applet code=com.objectplanet.chart.ChartApplet
archive=chart.jar width=200 height=140>
<param name=chart value="bar">
<param name=sampleValues value="6,5,8, ... ,5,4,3">
<param name=sampleScrollerOn value="true">
<param name=visibleSamples value="0,10">
</applet>
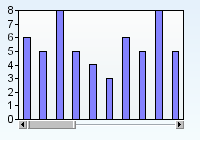
The first field in the visibleSamples parameter is the starting sample. The second field is the number of samples to be displayed initially.
You can turn on horizontal grid value lines using the valueLinesOn parameter.
<applet code=com.objectplanet.chart.ChartApplet
archive=chart.jar width=200 height=140>
<param name=chart value="bar">
<param name=sampleValues value="10,20,30,40,50">
<param name=valueLinesOn value="true">
</applet>

You can set the color of the value lines using the valueLinesColor parameter.
<applet code=com.objectplanet.chart.ChartApplet
archive=chart.jar width=200 height=140>
<param name=chart value="bar">
<param name=sampleValues value="10,20,30,40,50">
<param name=valueLinesOn value="true">
<param name=valueLinesColor value="white">
<param name=chartBackground value="lightGray">
<param name=background value="lightGray">
</applet>
The jumps in the value lines and range labels is controlled by the space available for the value lines and range labels. You can not control the jumps directly, but you can set the maximum number of lines you want using the maxValueLineCount parameter.
<applet code=com.objectplanet.chart.ChartApplet
archive=chart.jar width=200 height=140>
<param name=chart value="bar">
<param name=sampleValues value="10,20,30,40,50">
<param name=valueLinesOn value="true">
<param name=maxValueLineCount value="2">
</applet>

5.4 Default vertical grid lines
Set default vertical grid lines using the defaultGridLinesOn parameter
<applet code=com.objectplanet.chart.ChartApplet
archive=chart.jar width=200 height=140>
<param name=chart value="bar">
<param name=sampleValues value="10,20,30,40,50">
<param name=defaultGridLinesOn value="true">
</applet>

You can also define the position of the first line and step between the lines. Specifying color for the lines is also available.
<applet code=com.objectplanet.chart.ChartApplet
archive=chart.jar width=200 height=140>
<param name=chart value="bar">
<param name=sampleValues value="10,20,30,40,50">
<param name=defaultGridLinesOn value="true,5,10">
<param name=defaultGridLinesColor value="green">
</applet>
Set vertical grid lines using the gridLines parameter.
<applet code=com.objectplanet.chart.ChartApplet
archive=chart.jar width=200 height=140>
<param name=chart value="bar">
<param name=sampleValues value="10,20,30,40,50">
<param name=gridLines value="10,30,70">
</applet>

The position of each grid line is a value between 0 and 100 relative to the width of the chart grid. However, you can change the sample axis range to fit your application better.
<applet code=com.objectplanet.chart.ChartApplet
archive=chart.jar width=200 height=140>
<param name=chart value="bar">
<param name=sampleValues value="10,20,30,40,50,60,70,80,90,100,110,120">
<param name=sampleLabels value="j,f,m,a,m,j,j,a,s,o,n,d">
<param name=barLabelsOn value=true>
<param name=sampleAxisRange value="0,12">
<param name=gridLines value="2.5,4,8.8">
</applet>
You can set the color of each individual grid line.
<applet code=com.objectplanet.chart.ChartApplet
archive=chart.jar width=200 height=140>
<param name=chart value="bar">
<param name=sampleValues value="10,20,30,40,50">
<param name=gridLines value="10,30,70,80">
<param name=gridLineColors value="red,green,orange,blue">
</applet>
The bars can be displayed vertically (default) or horizontally. Use the barAlignment parameter to control the display alignment.
<applet code=com.objectplanet.chart.ChartApplet
archive=chart.jar width=200 height=140>
<param name=chart value="bar">
<param name=sampleValues value="10,20,30,40,50">
<param name=sampleLabels value="one,two,three,four,five">
<param name=barLabelsOn value="true">
<param name=barAlignment value="horizontal">
</applet>
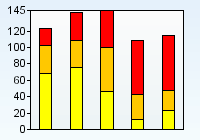
When multiple data series are used the bars of the same sample can either be displayed side by side or stacked on top of each other. Default is side by side.
<applet code=com.objectplanet.chart.ChartApplet
archive=chart.jar width=200 height=140>
<param name=chart value="bar">
<param name=seriesCount value="3">
<param name=sampleValues_0 value="68,75,46,12,23">
<param name=sampleValues_1 value="34,34,54,31,25">
<param name=sampleValues_2 value="21,34,45,66,67">
<param name=sampleColors value="yellow, orange, red">
<param name=multiColorOn value="true">
<param name=barType value="side">
</applet>
With bar type set to stacked we get the following chart.
<applet code=com.objectplanet.chart.ChartApplet
archive=chart.jar width=200 height=140>
<param name=chart value="bar">
<param name=seriesCount value="3">
<param name=sampleValues_0 value="68,75,46,12,23">
<param name=sampleValues_1 value="34,34,54,31,25">
<param name=sampleValues_2 value="21,34,45,66,67">
<param name=sampleColors value="yellow, orange, red">
<param name=multiColorOn value="true">
<param name=barType value="stacked">
</applet>
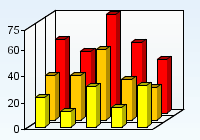
We can have bar series rendered behind each other when setting type to behind.
<applet code=com.objectplanet.chart.ChartApplet
archive=chart.jar width=200 height=140>
<param name=chart value="bar">
<param name=seriesCount value="3">
<param name=sampleValues_0 value="23,12,31,15,32">
<param name=sampleValues_1 value="34,34,54,31,25">
<param name=sampleValues_2 value="56,47,75,54,41">
<param name=sampleColors value="yellow, orange, red">
<param name=multiColorOn value="true">
<param name=barType value="behind">
<param name=3DModeOn value="true">
<param name=3DDepth value="25">
</applet>
You can turn off the outline around the bars using the barOutlineOff parameter.
<applet code=com.objectplanet.chart.ChartApplet
archive=chart.jar width=200 height=140>
<param name=chart value="bar">
<param name=sampleValues value="10,20,30,40,50">
<param name=barOutlineOff value="true">
</applet>
You can set the color of the bar outline.
<applet code=com.objectplanet.chart.ChartApplet
archive=chart.jar width=200 height=140>
<param name=chart value="bar">
<param name=sampleValues value="10,20,30,40,50">
<param name=sampleColors value="orange">
<param name=barOutlineColor value="red">
</applet>
You can control the relative width of each bar by using the barWidth parameter. The width is relative to the width of the chart grid and the number of samples. If the width is set to 0.5, the bar will occupy half the space given to it. If the width is set to 1.0, the bar will occupy all the space given to it.
<applet code=com.objectplanet.chart.ChartApplet
archive=chart.jar width=200 height=140>
<param name=chart value="bar">
<param name=sampleValues value="10,20,30,40,50">
<param name=barWidth value="1.0">
</applet>
If the chart has multiple data series, the bar width will control the combined width given to all the bars in one sample.
<applet code=com.objectplanet.chart.ChartApplet
archive=chart.jar width=200 height=140>
<param name=chart value="bar">
<param name=seriesCount value="3">
<param name=sampleValues_0 value="68,75,46,12,23">
<param name=sampleValues_1 value="34,34,54,31,25">
<param name=sampleValues_2 value="21,34,45,66,67">
<param name=sampleColors value="yellow, orange, red">
<param name=multiColorOn value="true">
<param name=barWidth value="0.7">
</applet>
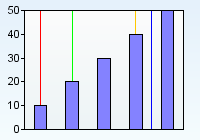
You can add a horizontal line at a specified value position in the chart grid. The line can have any color and a label to the left of it. Use the targetValueLine_N parameter to add target value lines.
<applet code=com.objectplanet.chart.ChartApplet
archive=chart.jar width=200 height=140>
<param name=chart value="bar">
<param name=sampleValues value="10,20,30,40,50">
<param name=targetValueLine_0 value="Target A, 15, red">
<param name=targetValueLine_1 value="Target B, 40, blue">
<param name=targetValueLine_2 value="Target C, 25, gray, value">
</applet>
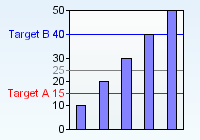
The first field in the target parameter is the label to be displayed. The second field is the value where it should be painted. The third parameter is the color (use the color name or a hex code) of the line and label. The fourth and optional parameter states if only the value should be displayed (value) or only the label (label). Both the label and the value are displayed by default.
You can add a URL or javascript call to any bar, sample, or data series in the chart and have the applet open a new web page when the user double-clicks the bar or legend entry. You must include the MAYSCRIPT parameter in the applet tag if you want to call javascript functions.
Have the url point to a web page containing another chart to create drilldown charts.
<applet code=com.objectplanet.chart.ChartApplet
archive=chart.jar width=200 height=140 MAYSCRIPT>
<param name=chart value="bar">
<param name=sampleValues value="10,20,30,40,50">
<param name=url_0 value="chart1.html">
<param name=url_1 value="chart2.html">
<param name=url_2 value="chart3.html">
<param name=url_3 value="chart4.html">
<param name=url_4 value="javascript:winOpen('bar.html', 200,500);">
</applet>
The parameter url_0 adds a URL to the first bar in the above example. Use the parameter url to add a default url to all the samples.
In a chart having multiple data series, the url_N parameter adds a url to series N. The parameter url_N_M adds a url to sample M in data series N.
<applet code=com.objectplanet.chart.ChartApplet
archive=chart.jar width=200 height=140>
<param name=chart value="bar">
<param name=seriesCount value="2">
<param name=sampleValues_0 value="10,20,30,40,50">
<param name=sampleValues_1 value="20,30,40,50,60">
<param name=url_0_0 value="chart1.html">
<param name=url_1_0 value="chart2.html">
</applet>
The example above adds a url to the two leftmost bars (the two bars of the first sample).
You can also set the URLs programatically by calling setParameter("url_0", "myurl");
You can add a label with URL to any point in the chart and have applet open a new web page when user clicks the label.
<applet code=com.objectplanet.chart.ChartApplet
archive=chart.jar width=300 height=200>
<param name=chart value="bar">
<param name=sampleValues value="10,20,30,40,50">
<param name=multiColorOn value=true>
<param name=label_0 value="url one, 35, 30">
<param name=label_1 value="url two, 85, 90">
<param name=label_2 value="url three, 140, 60">
<param name=label_3 value="url four, 190, 120">
<param name=label_4 value="url five, 245, 150">
<param name=labelURL_0 value="bar_url_sub.html#one">
<param name=labelURL_1 value="bar_url_sub.html#two">
<param name=labelURL_2 value="bar_url_sub.html#three">
<param name=labelURL_3 value="bar_url_sub.html#four">
<param name=labelURL_4 value="bar_url_sub.html#five">
</applet>
The parameter urltarget, urltarget_N, urltarget_N_M adds a target window where the new web page should be opened. The parameter labelURLTarget and labelURLTarget_N specifies the target widow for the anywhere labels with URLs. The default behavior is to open the new page in the same window.
The different parameter values are:
_self: Open new page in same window or frame.
_parent: Open in the parent window.
_top: Open in the top-level window.
_blank:Open in a new blank window.
name:Open in the frame or window with the specified name.
Use the singleClickURLOn parameter to use single click drilldowns.
Force multiseries mode
Some times you want the chart to behave the same way with one data series
as with many data series, such as having the series label in the legend
instead of the sample labels and the colors of the bars.
<applet code=com.objectplanet.chart.ChartApplet
archive=chart.jar width=200 height=140>
<param name=chart value="bar">
<param name=sampleValues value="10,20,30,40,50">
<param name=sampleLabels value="one,two,three,four,five">
<param name=barLabelsOn value=true>
<param name=seriesLabels value="Data A">
<param name=legendOn value="true">
<param name=multiColorOn value="true">
</applet>
The above applet will display the chart with a legend entry for each sample.
By turning on the multiSeriesOn parameter, the chart will display the legend with the series label. Also, the bars will be displayed with one color, which will be the color assigned for the first data series.
<applet code=com.objectplanet.chart.ChartApplet
archive=chart.jar width=200 height=140>
<param name=chart value="bar">
<param name=sampleValues value="10,20,30,40,50">
<param name=sampleLabels value="one,two,three,four,five">
<param name=barLabelsOn value=true>
<param name=seriesLabels value="Data A">
<param name=legendOn value="true">
<param name=multiColorOn value="true">
<param name=multiSeriesOn value="true">
</applet>
The sizing of the chart grid is automatically calculated based on the size and position of other elements in the chart. You can explicitly set the chart grid by using the graphInsets parameter.
<applet code=com.objectplanet.chart.ChartApplet
archive=chart.jar width=200 height=140>
<param name=chart value="bar">
<param name=sampleValues value="10,20,30,40,50">
<param name=graphInsets value="0,0,0,0">
<param name=valueLabelsOn value="true">
<param name=valueLabelStyle value="inside">
</applet>
The sequence of the graphInsets parameter value is top, left, bottom, right. If you use -1 for any of the fields, the default inset for that side will be set.
<applet code=com.objectplanet.chart.ChartApplet
archive=chart.jar width=200 height=140>
<param name=chart value="bar">
<param name=sampleValues value="10,20,30,40,50">
<param name=graphInsets value="50,50,50,50">
</applet>
The user can control the size and position of the chart grid at runtime by clicking on a chart grid edge and dragging it. Use the gridAdjustmentOn parameter to turn this behaviour on.
<applet code=com.objectplanet.chart.ChartApplet
archive=chart.jar width=200 height=140>
<param name=chart value="bar">
<param name=sampleValues value="10,20,30,40,50">
<param name=gridAdjustmentOn value="top,left,bottom,right">
</applet>
Color names:
black, blue, cyan, darkGray, gray, green, lightGray, magenta, orange,
pink, red, white, yellow