Network Probe Evolution
[click here for full list of changes and bug fixes]
Network Probe 2.0
january 31st 2007;)
Network Probe 2.0 added a new main screen displaying the network summary with a network throughput chart and a speedometer displaying max and average traffic volume.
This version also added tables and charts displaying top protocols, talkers, listeners, hosts, and conversations. You can also display the throughput for individual protocols, hosts, and conversations.
You can also filter the packet capture on ethernet addresses and address ranges in addition to IP address and protocol ranges.
A silent host name resolution was added to avoid Network Probe generating traffic.
Network Probe 2.1
march 19th 2007;)
User-selected hosts:
Set up a list of your own hosts to be monitored by typing in the IP address and an optional comment for the host, and it will be added to the 'My Hosts' list.
;)
User-selected conversations:
Set up a list of your own conversations to be monitored by typing in the IP address of the source and destination and an optional comment for it, and the conversation will be added to the 'My Conversations' list.
;)
User-selected protocols:
Set up a list of your own protocols to be monitored by typing in the port number and an optional comment, and it will be added to the 'My Protocols' list.
;)
User-selected protocols per host:
Set up a list of specific protocols used by individual hosts to be monitored. Type in the IP address of the host and the port number of the protocol, and the protocol will be added to the 'My Protocols per host' list.
Network Probe 2.5
september 10th 2007;)
;)
Adding alarms:
Network Probe 2.5 adds the possibility to monitor individual protocols, hosts, conversations, network cards, and any other entity monitored by the probe, and send an alarm if anything of significance happens.
You can define any number of alarms and define its attributes such as description, severity, thresholds, etc.
When an alarm is triggered it will then show up color-coded to its specified severity in the alarms window with a time-stamp, and the trigger value causing the alarm.
;)
;)
Saving layouts and sessions:
Create and store user-defined profiles and layouts to restore your last window layout or load pre-defined layouts and setups for specific tasks.
Each user can easily create, edit and switch active profiles using the profile manager.
In addition to having a default profile being loaded when you log in, you can always choose the current profile in runtime.
Network Probe 2.6
november 22nd 2007;)
Adding alarm trigger emails:
Network Probe 2.6 adds the possibility to send e-mails when alarms are triggered. The emails are fully customizable and you can send any number of emails per alarm triggered.
An email can be sent to multiple recipients and the details of the statistics entry triggering the alarm can be included in the content of the email.
In addition to the user-specified content, the alarm's xml data is also appended to the e-mail.
;)
You can also add frequently used emails to the alarm trigger action library.
;)
Network Probe 2.7
march 6th 2008New and improved user interface:
;)
;)
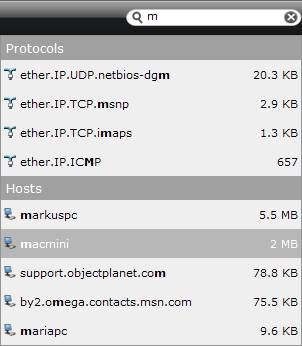
Search field:
A search field was added to the main screen's top menu and lets you easily and quickly find hosts and protocols of interest.
Just start typing in what you are looking for in the search field, and Network Probe will suggest hosts and protocols found on your network and sort the suggested entries by their byte count.
Once the host or protocol of interest is found, the entry can be added to the My protocols or My hosts table, or you can open a new window to view the entry details.
;)
Adding alarm trigger scripts:
Network Probe 2.7 adds the possibility to run programs when alarms are triggered. The programs or scripts can be configured to start using alarm details as parameters to the program or script.
You can also add frequently used alarm trigger scripts to the alarm action library.
;)
;)
Window bar:
The status bar in Network Probe 2.7 makes managing multiple windows easy. The status bar can be used to minimize, maximize or to close windows.
Detached chart windows can also be attached to their parent window using the status bar.
;)
Max speedometer value:
Network Probe 2.7 lets you configure a max value for the throughput speedometer. With no max value set, the highest value in the meter is the peak of the traffic throughput. By setting a max value you can adjust the speedometer to match the bandwidth of your network.
Network Probe 3.0
march 24th 2009;)
Network Probe Enterprise Version:
Network Probe version 3 introduces an Enterprise Probe which can collect and display traffic statistics from multiple remote probes spanning your entire organization or enterprise.
By installing an enterprise probe you can now have a total overview of the traffic situtation on all your networks from one single user interface. After login you will see an overview of the most active networks as well as all triggered alarms.
;)
Single probe login:
With the enterprise version, there is no longer a need for logging into each individual probe you want to monitor.
You can now simply search for or select the probe you want and all the detailed traffic statistics will be available, just as if you were logged on directly to that probe.
;)
Network drilldown:
Selecting a probe from the top networks list you can drill down into more detailed traffic statistics for that network such as the top protocols, talkers, and listeners.
Simply do a right-click on the probe entry and zoom in. The detailed statistics for that probe will then be displayed.
Extensive performance improvements:
Network Probe version 3 has had a total overhaul of the user interface code, and especially the "Traffic Statistics" and "Traffic Log" has been improved multifold.
- The data loading time is dramatically shorter
- Scrolling through the data is a lot faster
- Searching, sorting, and filtering the data is a lot faster
- Dramatically reduced the memory usage, fixing problems with out of memory errors
Some of the work earlier performed by the probe on behalf of the client is now done on the client side, leaving the probe free to collect and analyze the network data as it should do.